
Gabi Seifert
she/her
Physics PhD student at the University of Colorado Boulder specializing in atomic, molecular, and optical physics.

Physics PhD student at the University of Colorado Boulder specializing in atomic, molecular, and optical physics.
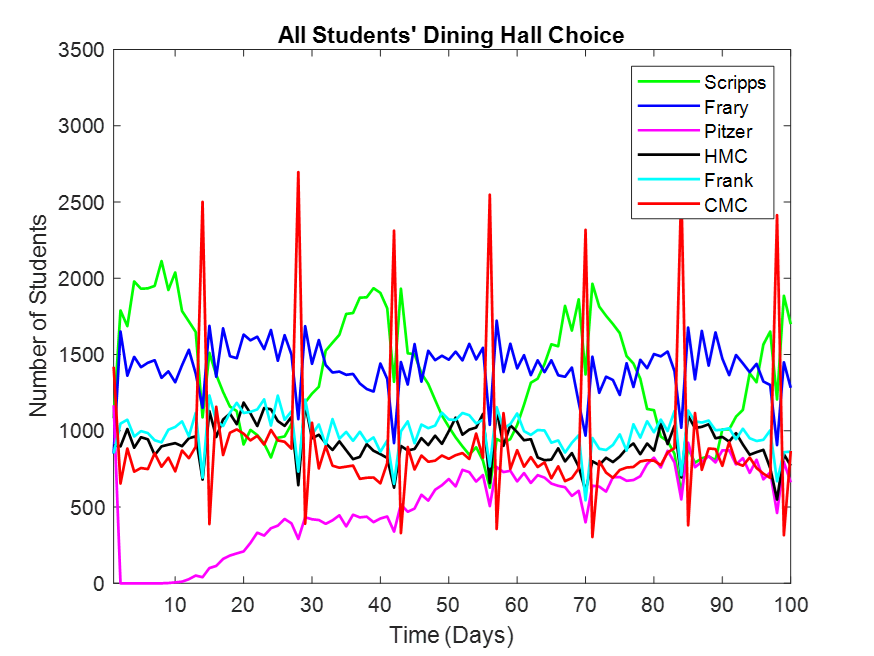
Figure 1. All Students’ Dining Hall Choice. Scripps and Frary are the most popular (true to real life), Scripps' quality changes every two weeks (true to real life), Pitzer is initially unpopular but will regain its former high status, CMC is wildly unpopular with twice-weekly massive spikes in students (true to real life).
In 2022, I took Computational Science and Engineering at Scripps College, a class focused on using computational methods in scientific computing software Maple and MATLAB to solve real-world physics problems too difficult to do by hand.
For the final project, I decided to model a silly but complicated real-world situation in MATLAB: the dining halls at the Claremont Colleges. The Claremont Colleges are a consortium of five colleges, all located within a 1-square-mile campus just outside of Los Angeles. There are six dining halls available to students, one at each college with two at Pomona. Students are free to eat at any dining hall, which each have their own styles of food as well as reputations, so I wanted to predict the dining hall popularity over the course of a semester.
I wanted to see if I could write a complex script in MATLAB, incorporating user input, 3-dimensional data sets, complicated variables, and useful visualizations.
The script goes through each day (time loop), each college, and every student. Every student decides which dining hall to go to by finding a “value” (desirability) of each dining hall and then going to the dining hall with the highest value. If no value is high enough, the student just stays home.
The code to determine the “value” of a college (in this case the Pitzer dining hall for a non-Pitzer student) is:
Pval = randi(1000) + Pqual - 50*Dist(C, 3) - .05*Ptot(6, t-1) + .5*Ptot(C, t) - 5000/(t);
Users can rate the importance of four variables and MATLAB plots out what the dining hall trends would be if everyone agreed with these inputs. If the user inputs are outside the acceptable range, MATLAB will reject them. The scaling modifiers in front of each term were determined by asking my friends which factors were most important in deciding which dining hall to go to.
Here are some of the graphs produced. The exact graphs change slightly every time the code is run because of the user input and the random factor, but these particular graphs are fairly average.
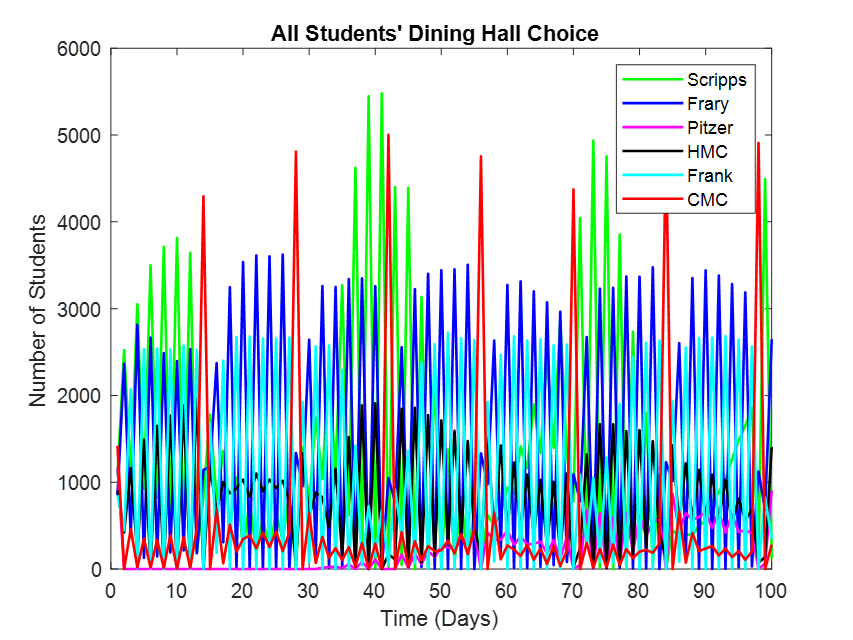
Figure 2. If Everybody Cared the Most About Everything (all variables are of the highest importance). In this case the Claremont Colleges dining hall system becomes reactionary chaos. A user will receive a warning of the impending chaos if they place too much value on crowding.
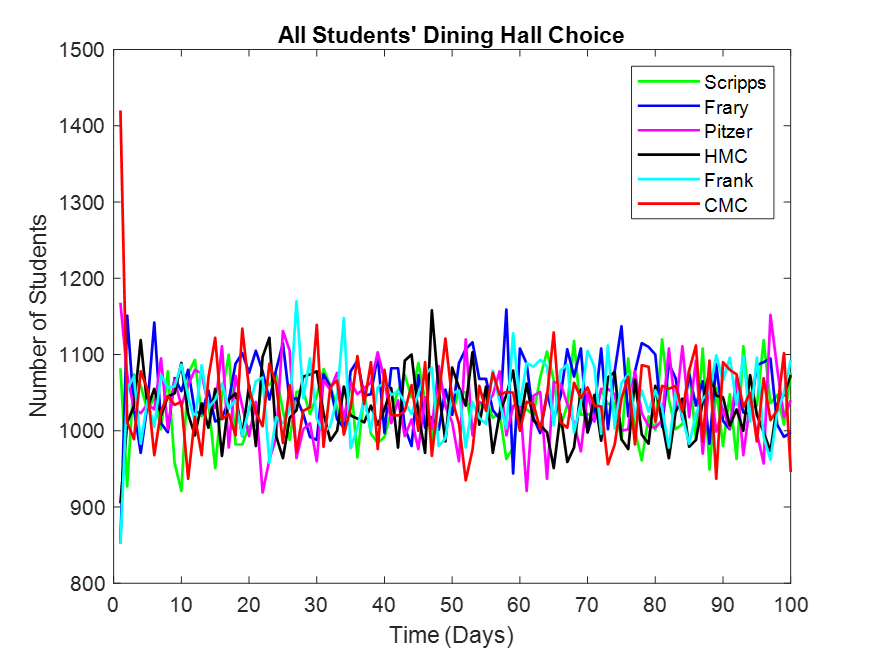
Figure 3. No One Cares About Anything (all variables are of the lowest importance). In this case everyone just chooses a dining hall at random, and they each stay about equally busy every day for the entire semester.
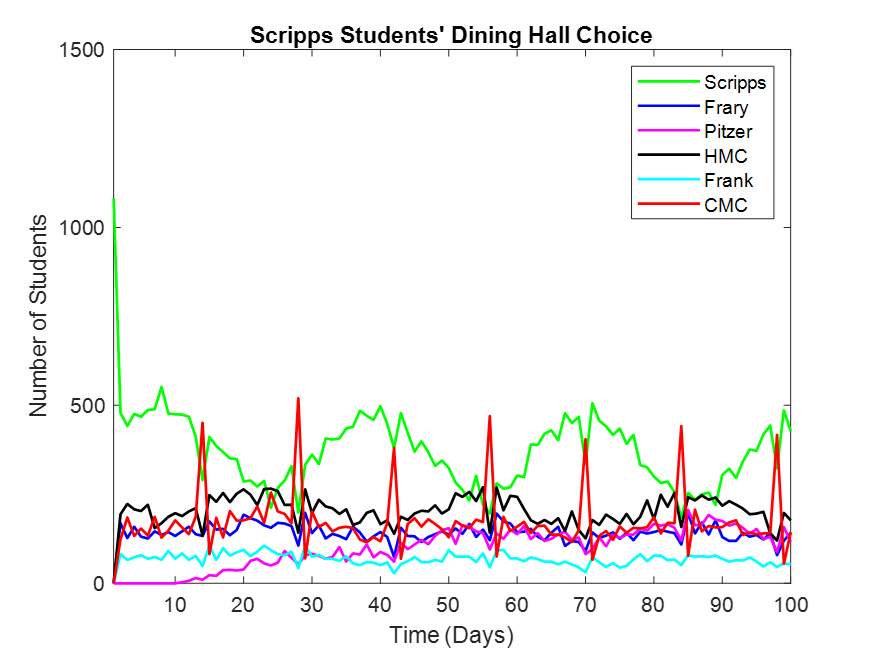
Figure 4. Scripps Students’ Dining Hall Choice. I selected this graph because it’s fairly representative of each individual college’s patterns. Scripps students tend to prefer their own dining hall but on special days CMC is more popular. They are also strongly biased against Frank because it’s so far away.
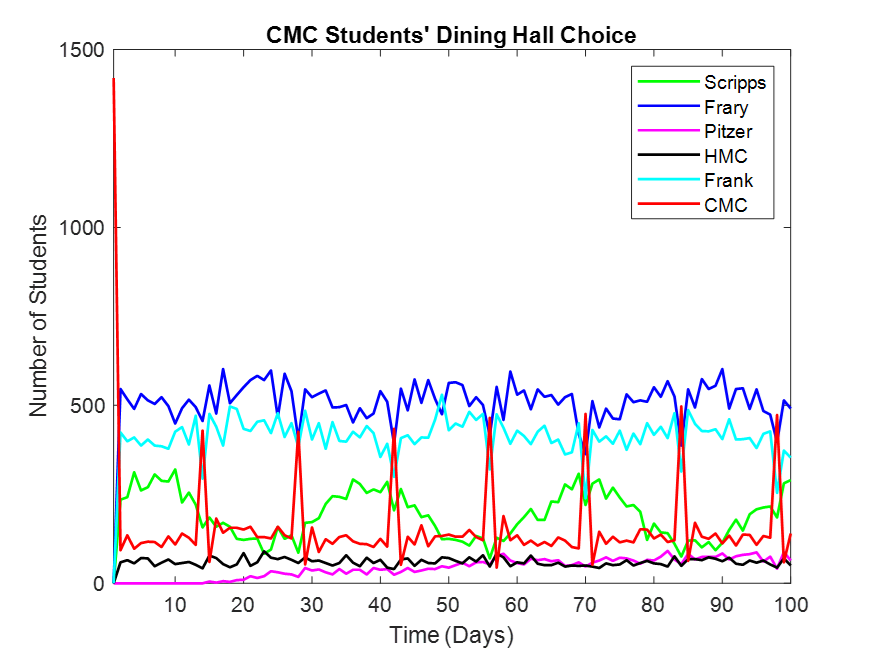
Figure 5. CMC Students’ Dining Hall Choice. This graph is particularly interesting because CMC students strongly prefer Pomona dining halls above their own. This is true to real life, and reflects the opinions shared with me by CMC students when polled.

